|
|||||
|
|||||
LESSON INTRODUCTIONS: It is strongly recommended that as you begin studying a lesson by reading these lesson introductions.
Unit 1: ECONOMICS and GLOBALIZATION
|
Unit 2: INTRODUCTION TO MACROECONOMICS |
Unit 3: MONETARY POLICY |
Unit 4 FISCAL POLICY |
Welcome to ECO 212!
This course will cover the area of economics commonly defined as macroeconomics. The main goal of macroeconomics is to gain a better understanding of the causes of, and remedies for, UNEMPLOYMENT and INFLATION, as well as the factors that affect ECONOMIC GROWTH. We will also discuss the two types of economic growth, what I like to call "ACHIEVING THE POTENTIAL" and "INCREASING THE POTENTIAL".
Please buy the textbook as soon as possible. If you buy your textbook online, order it today. See the syllabus for the correct textbook. For a list of online sources of our textbook for CHEAP, click HERE and scroll down:
While you wait for your textbook to arrive there is still some work that you can do.
To begin, I suggest you do the following:
Email me or use the Blackboard Discussion Board if you have questions.
Good luck and start studying.
The "5Es of Economics" are not from the textbook. I borrowed the concept (with many modifications) from another textbook many years ago. I believe it concisely explains the purpose of economics. Also, it begins to introduce students to the economic way of thinking. The economic problem that we all face, that all countries face, that the world faces, is SCARCITY. Economics is the study of how we can reduce scarcity. What I like about the 5Es model is that it shows us that there are only five ways to reduce scarcity. Only five. Simple.
For each of the 5Es (1) learn the defininition, (2) understand examples, and most importantly, (3) know how they reduce scarcity and help to maximize society's satisfaction.
This is where you learn that it may be good when the price of plywood increases greatly during a hurricane. And it might be good when Coca-Cola lays of one fifth of its workforce. Or, that the price of gasoline may be too low. Really.
|
In this MACROeconomics course we will focus on Economic Growth and Full Employment. Efficiency, efficiency and equity are the focus of my MICROecoomics classes and few economists study "Reducing Wants". The overall goal of economics is to REDUCE the SCARCITY of goods and services. Economic growth and full employment are two (of five) ways to do this. Pay close attention to the new definition of economic growth presented in the online reading. It is different from what you might hear in a news report. Also, pay attention to HOW such economic growth is achieved: finding more resources, getting better resources, and inventing better technology. This is what we will call INCREASING THE POTENTIAL of the economy to produce goods and services. Full employment helps an economy ACHIEVE its potential by using all of its resources. Again, notice the slightly different definition than is commonly used for fullemployment. We are not just talking about labor, but ALL available resources. |
|
Here we will study our second graphical model: the PPC. The production possibilities curve will show us that all decisions have costs. Economists call these "opportunity costs". ALL COSTS IN ECONOMICS ARE OPPORTUNITY COSTS. Whenever we discuss the "costs" of doing something we will mean the complete opportunity cost.
What is the connection between the PPC and BCA? Well, when studying the PPC you will learn the important concept of "opportunity cost". Learn the definition well. Since all costs in economics are opportunity costs, then when using BCA, "marginal costs" mean the additional opportunity costs.
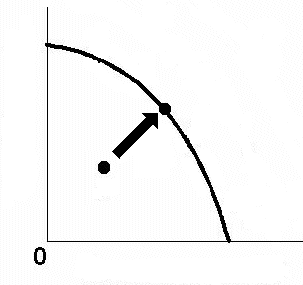
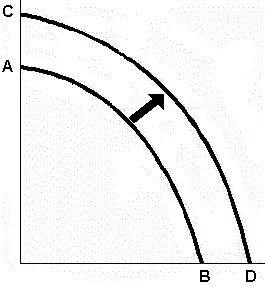
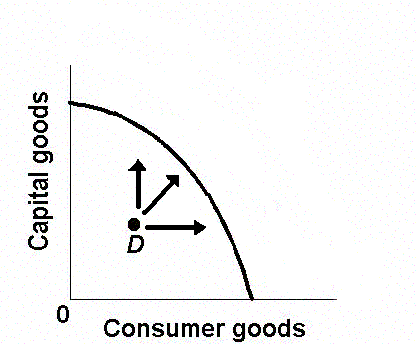
Also, the PPC nicely demonstrates the difference between an economy ACHIEVING ITS POTENTIAL and INCREASING ITS POTENTIAL. Achieving the potential is caused by reducing unemployment or achieving productive efficiency. On the graph it is moving from a point inside the PPC to a point on the SAME CURVE. Increasing the potential, or economic growth, is shown on the PPC as the whole curve shifting out to a NEW CURVE. We will see this again in chapter 8.
Key Graphs:
If the price of pizza goes up, what happens to the demand for pizza?. . . . . . . . . . . . . . . . . NOTHING happens to the demand for pizza if the price changes!
The next three modules introduce the demand and supply model for explaining how prices arise and change in a market economy. Learn these modules well. Do the assigned problems. Draw the graphs in the yellow pages and while you are reading and studying. DRAW GRAPHS! Get used to using the graphs to help you answer questions. If you are avoiding drawing the graphs you will do poorly and not get the practice that you need to learn the concept.
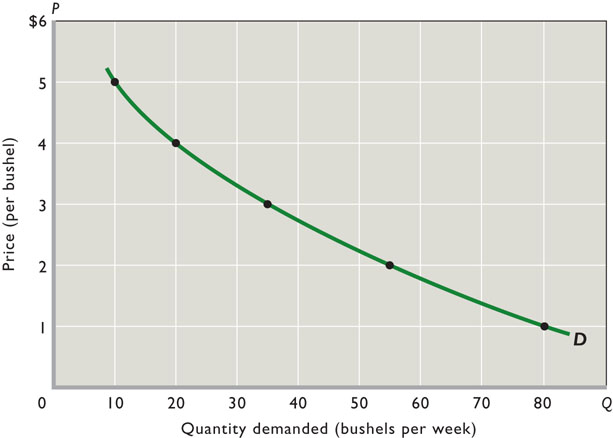
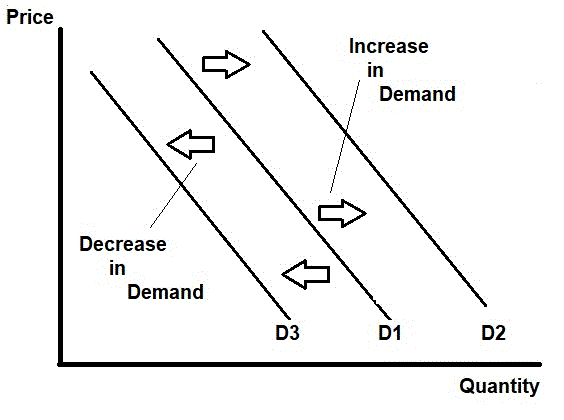
So why doesn't the demand for pizza change if the price changes? Because economists have a different definition of "demand". Demand is NOT the quantity that we buy. If the price of pizza goes up we will buy less, but that is not what "demand" means in economics. Economists tend to be precise with their definitions and sometimes their definitions are different than the more commonly used definitions. Things like "scarcity", "investment", "cost", "demand", and "supply", have different definitions in economics than what you may already know. Learn our definitions! Demand is not how much we buy. Demand has a different definition in economics. "Demand" means the "demand graph".
Remember, that econmists use models (like the supply and demand model) to simplify the real world. They do this by isolating certain variables from all the clutter found in reality. Then by changing one variable at a time economists can see what effect it will have. In this module we will learn the economic definition of DEMAND and plot the demand graph. Then, we will look at one variable at a time to see what effect they have on the demand curve.. We call these variables the "non-price determinants of demand". They are: Pe, Pog, I, Npot, T. LEARN THEM! LEARN THEM WELL! Know how each one effects the demand curve. Be sure to do the yellow pages. If you will not learn how the non-price determinants of demand affect the demand curve you may as well drop the course now. Do the Yellow Pages and other Practice Activities until you understand the concept well.
Key Graphs:

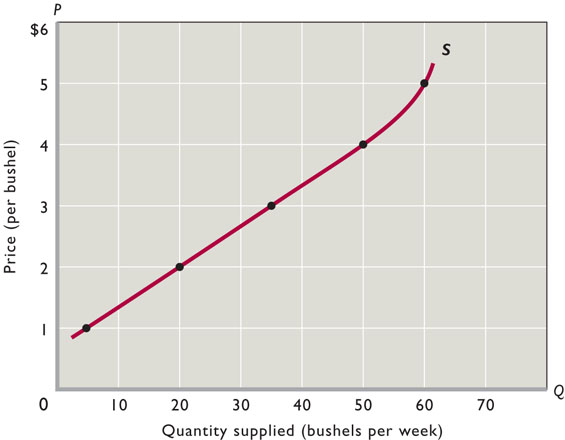
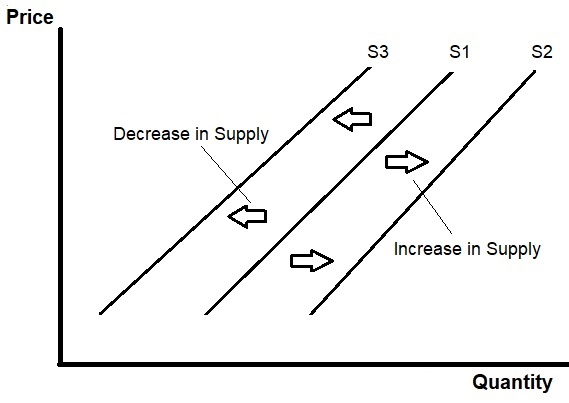
If the price of pizza goes up what happens to the SUPPLY of pizza? NOTHING! A change in the price of a product does not affect its supply, or its demand. When the price goes up the QUANTITY SUPPLIED will increase, but the supply does not change. Learn the difference between "supply" and "quantity supplied". "Supply" does NOT MEAN the quantity available for sale. Supply has a different definition in economics. "Supply" means the "Supply graph".
So what would cause the supply graph, or supply itself. to change? Those things that cause supply to change are called the "non-price determinants of supply". They are: Pe, POG, Pres, Tech, Tax, Nprod. See the Yellow Pages.
Remember, the goal of chapter 3 is to learn a model that will haelp us understand why prices are what they are and why they change. In the next lesson we will put demand and supply together and use the model (graph) to find the prices of products. Then, and more importantly, we will see ehat causes prices to change. If you hear on the.news or read in your news ap that the price of gasoline is going down, we will be able to explain WHY. The causes of changes in prices of products are the five non-price determinants of demand (Pe, Pog, I, Npot, T) and/or the six non-price determinants of supply (Pe, POG, Pres, Tech, Tax, Nprod.). Whenever you hear that the price of something is changing think of these 11 possible causes.
Key Graphs:
We are going to learn two very important things in this lesson.
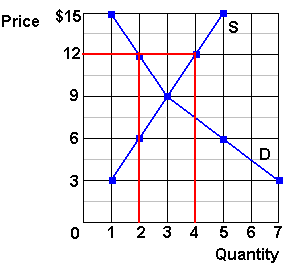
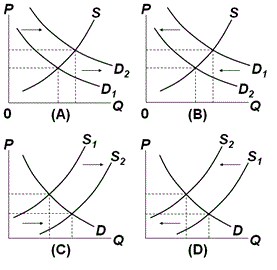
First, we will put demand and supply together and learn how to use the model to to see why products have the prices that they do and why those prices change. We will put demand and supply together and use the model (graph) to find the prices of products. Then, and more importantly, we will see what causes prices to change. If you hear on the news or read in your news app that the price of gasoline is going down, we will be able to explain WHY. The causes of changes in prices of products are the five non-price determinants of demand (Pe, Pog, I, Npot, T) and/or the six non-price determinants of supply (Pe, Pog, Pres, Tech, Tax, Nprod.). Whenever you hear that the price of something is changing think of which of these 11 possible causes have changed, draw the graph and shift the appropriate demand and/or supply graph, and the graph will show the price changing.
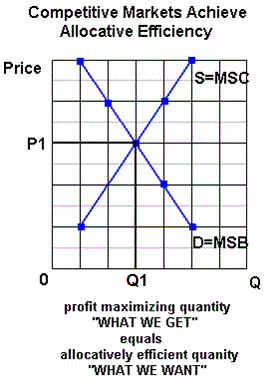
Second, we learn that in a competitive market economy the interaction of demand and supply will determine what the prices of products will be and how much people will buy at that price. Then, we will ask: Is this the allocatively efficient quantity and price? Our goal is to show that in a competitive market the price will change until allocative efficiency is achieved. In chapter 2 we learned that markets are efficient. That they will produce the quantity of goods that maximizes the society's satisfaction. Here will will show the allocativley efficient price and quantity on a graph. Competitive markets are efficient.
Key Graphs:
Key Graph:
Key Graphs:
Key Graphs:
Key Graphs:
Key Graphs:
Key Graphs and Figures:
Key Figures:
KEY GRAPHS
Money Demand
Increase in the money supply
Decrease in the money supply
KEY GRAPHS:
Easy (Expansionary) Money Policy:
Tight (Contractionary) Money Policy:
KEY GRAPHS
KEY GRAPHS
